Visualizing k6 load test results
Let's say you want to load test your website or app or service. Research for load testing tool then found k6 as your choice. The default option after you run k6 run you will get a summary of the load test result, like:
$ k6 run --out json=katze.gz katze.js

          /\      |‾‾| /‾‾/   /‾‾/
     /\  /  \     |  |/  /   /  /
    /  \/    \    |     (   /   ‾‾\
   /          \   |  |\  \ |  (‾)  |
  / __________ \  |__| \__\ \_____/ .io

  execution: local
     script: katze.js
     output: json (katze.gz)

  scenarios: (100.00%) 1 scenario, 20 max VUs, 3m30s max duration (incl. graceful stop):
           * default: Up to 20 looping VUs for 3m0s over 3 stages (gracefulRampDown: 30s, gracefulStop: 30s)


     ✓ status is 200

     checks.........................: 100.00% ✓ 2063     ✗ 0
     data_received..................: 178 MB  987 kB/s
     data_sent......................: 607 kB  3.4 kB/s
     http_req_blocked...............: avg=986.38µs min=0s      med=1µs     max=115.03ms p(90)=3µs     p(95)=3µs
     http_req_connecting............: avg=394.82µs min=0s      med=0s      max=49.1ms   p(90)=0s      p(95)=0s
     http_req_duration..............: avg=49.08ms  min=35.45ms med=45.61ms max=176.1ms  p(90)=62.76ms p(95)=68.14ms
       { expected_response:true }...: avg=49.08ms  min=35.45ms med=45.61ms max=176.1ms  p(90)=62.76ms p(95)=68.14ms
     http_req_failed................: 0.00%   ✓ 0        ✗ 2063
     http_req_receiving.............: avg=16.81ms  min=136µs   med=14.39ms max=124.22ms p(90)=23.99ms p(95)=27.42ms
     http_req_sending...............: avg=289.04µs min=29µs    med=195µs   max=10.44ms  p(90)=527.8µs p(95)=683.9µs
     http_req_tls_handshaking.......: avg=584.26µs min=0s      med=0s      max=71.85ms  p(90)=0s      p(95)=0s
     http_req_waiting...............: avg=31.98ms  min=19.84ms med=29.29ms max=112.45ms p(90)=42.54ms p(95)=46.55ms
   ✓ http_reqs......................: 2063    11.45447/s
     iteration_duration.............: avg=1.05s    min=1.03s   med=1.04s   max=1.28s    p(90)=1.06s   p(95)=1.06s
     iterations.....................: 2063    11.45447/s
     vus............................: 1       min=1      max=20
     vus_max........................: 20      min=20     max=20
There is an option -o / --out, for uri for an external metrics database. As explained in k6.io docs on Results output section https://k6.io/docs/results-output/overview/, there are two type of output:
- End of test, what showed up on cli command, can be. customized using
handleSummaryfunction - Real time, more granular data point that can be streamed or written to a file, https://k6.io/docs/results-output/real-time/
Parsing
For this case I will use --out json=... https://k6.io/docs/results-output/real-time/json/, to self-parse the granular metric data and then create diagrams with axes VU x RPS and RPS x Response time.
The raw data is formatted using jsonlines which each line contains a JSON object with two possibilities, a Metric object or a Point object.
/// Record type wrapper for k6 output result
#[derive(Serialize, Deserialize, Debug, Clone, Eq)]
#[serde(tag = "type")]
pub enum Record {
    Metric { data: DataMetric, metric: String },
    Point { data: DataPoint, metric: String },
}
Example raw data:
{"type":"Metric","data":{"type":"gauge","contains":"default","thresholds":[],"submetrics":null},"metric":"vus"}
{"type":"Point","data":{"time":"2017-05-09T14:34:45.625742514+02:00","value":5,"tags":null},"metric":"vus"}
{"type":"Metric","data":{"type":"trend","contains":"time","thresholds":["avg<1000"],"submetrics":null},"metric":"http_req_duration"}
{"type":"Point","data":{"time":"2017-05-09T14:34:45.239531499+02:00","value":459.865729,"tags":{"group":"::my group::json","method":"GET","status":"200","url":"https://httpbin.org/get"}},"metric":"http_req_duration"}
The parser program will decide on the object to create using the type attribute on each line.
For the main program, it will aggregate those Point objects, filtered and grouped by subtype and time. Subtype metric for example http_req_duration or vus; by time, e.g.: trimming sub-second data.
Example
Load testing https://katze.saktidwicahyono.name/, with scenario ramp-up from 0 to 25 virtual user for 6 minutes duration, will create following graph:
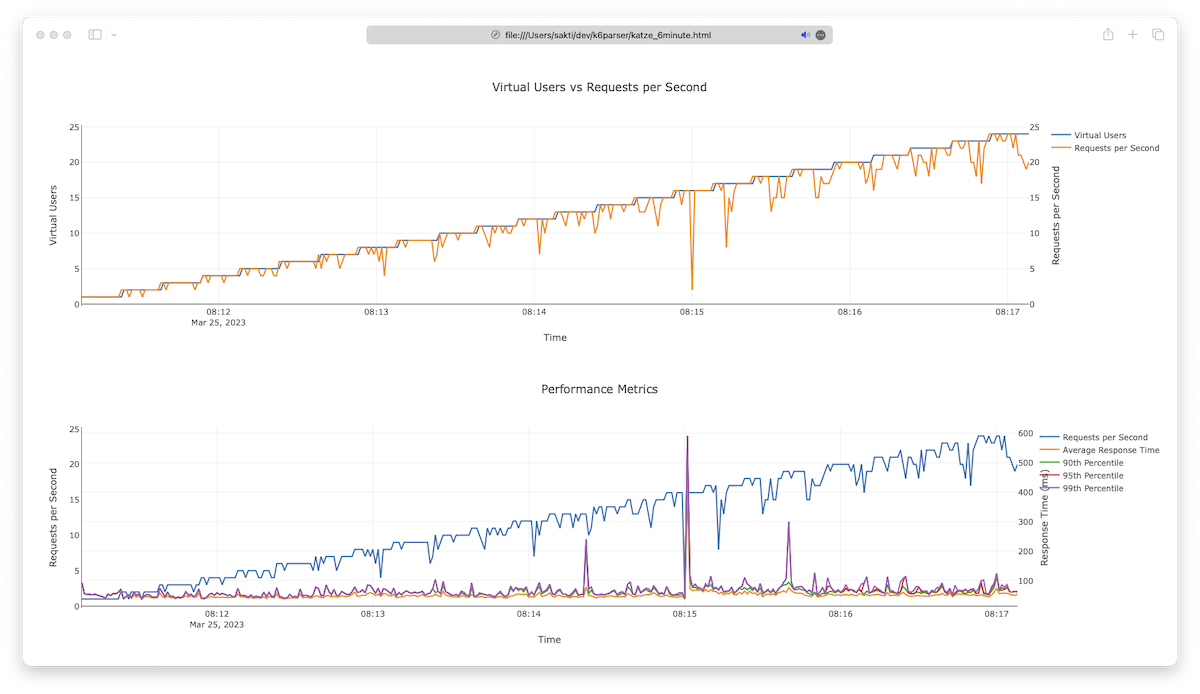
Notice at timestamp 8:15 there is a spike in response time and a drop in RPS metric. This is a characteristic of katze app, the app will fetch a random image of a cat and then convert it into ASCII art, for optimization the app has a cache system with a 5-minute timeout to cache ASCII art result. This is the time when the cache is expired.
Step by step
To generate the visualisation you can you k6parser tool.
# ensure your OS already has rust installed (https://rustup.rs/)
$ cargo install --git https://github.com/sakti/k6parser

# run load testing with --out parameter
$ k6 run --out json=katze.gz katze.js

# run k6parser
$ k6parser katze.gz

# open the result
$ open katze.html